React Flow DAG
Branching DAG with two pipelines showcasing blockr.react as alternative to g6R
Open in Playground →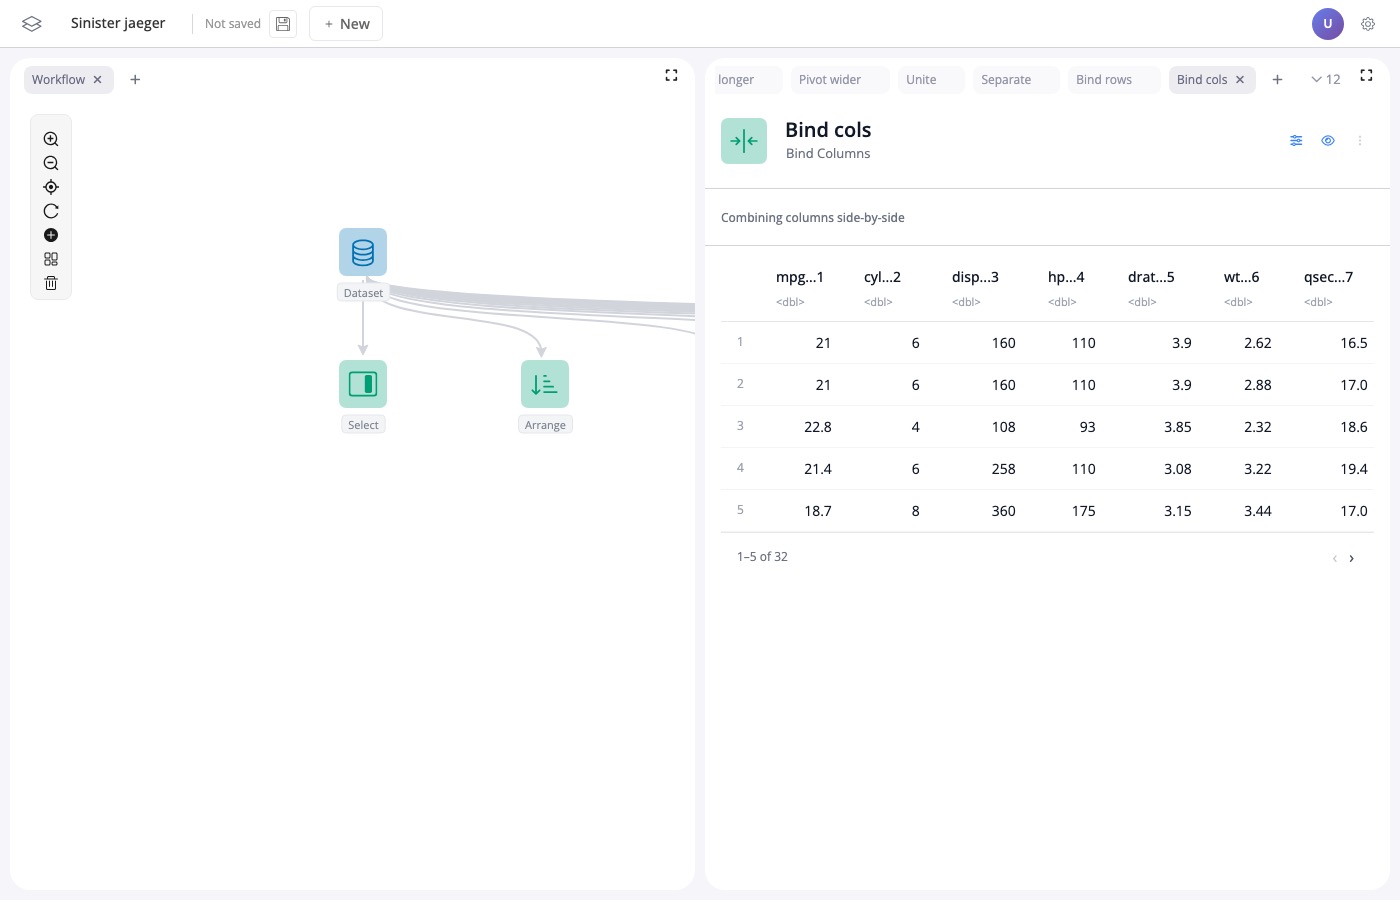
Preview All Blocks
Showcases all blockr.dplyr block types - column-picker, expression, join, reshape, variadic
Open in Playground →
Empty Workflow
Clean canvas with session management - start from scratch
Open in Playground →
Visualization Playground
Interactive charts with Highcharts and ECharts (blockr.playground)
Open in Playground →
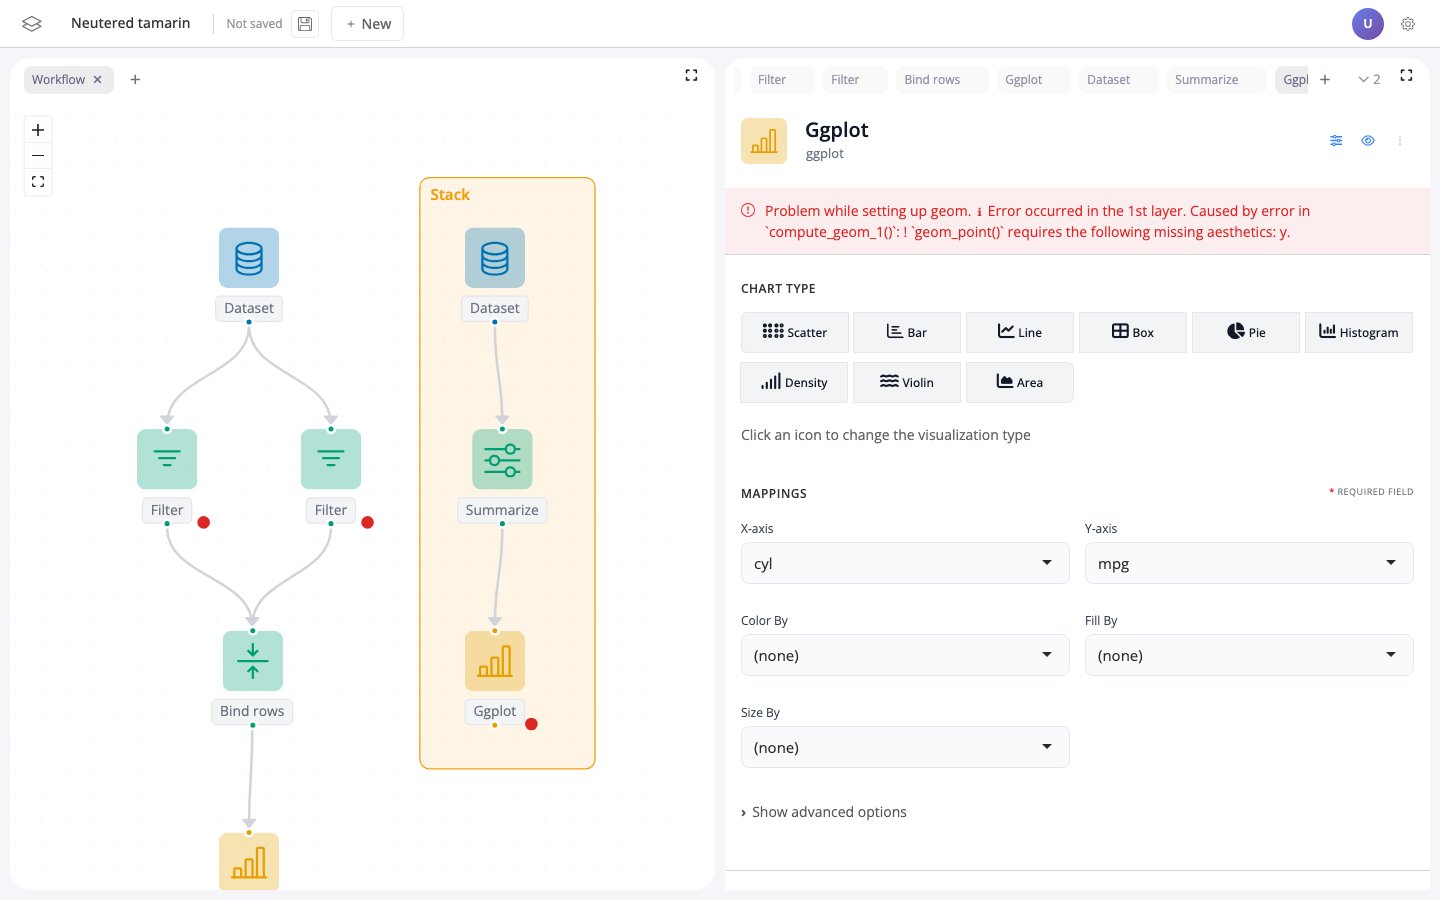
Linear Modeling
Statistical modeling with linear regression diagnostics
Open in Playground →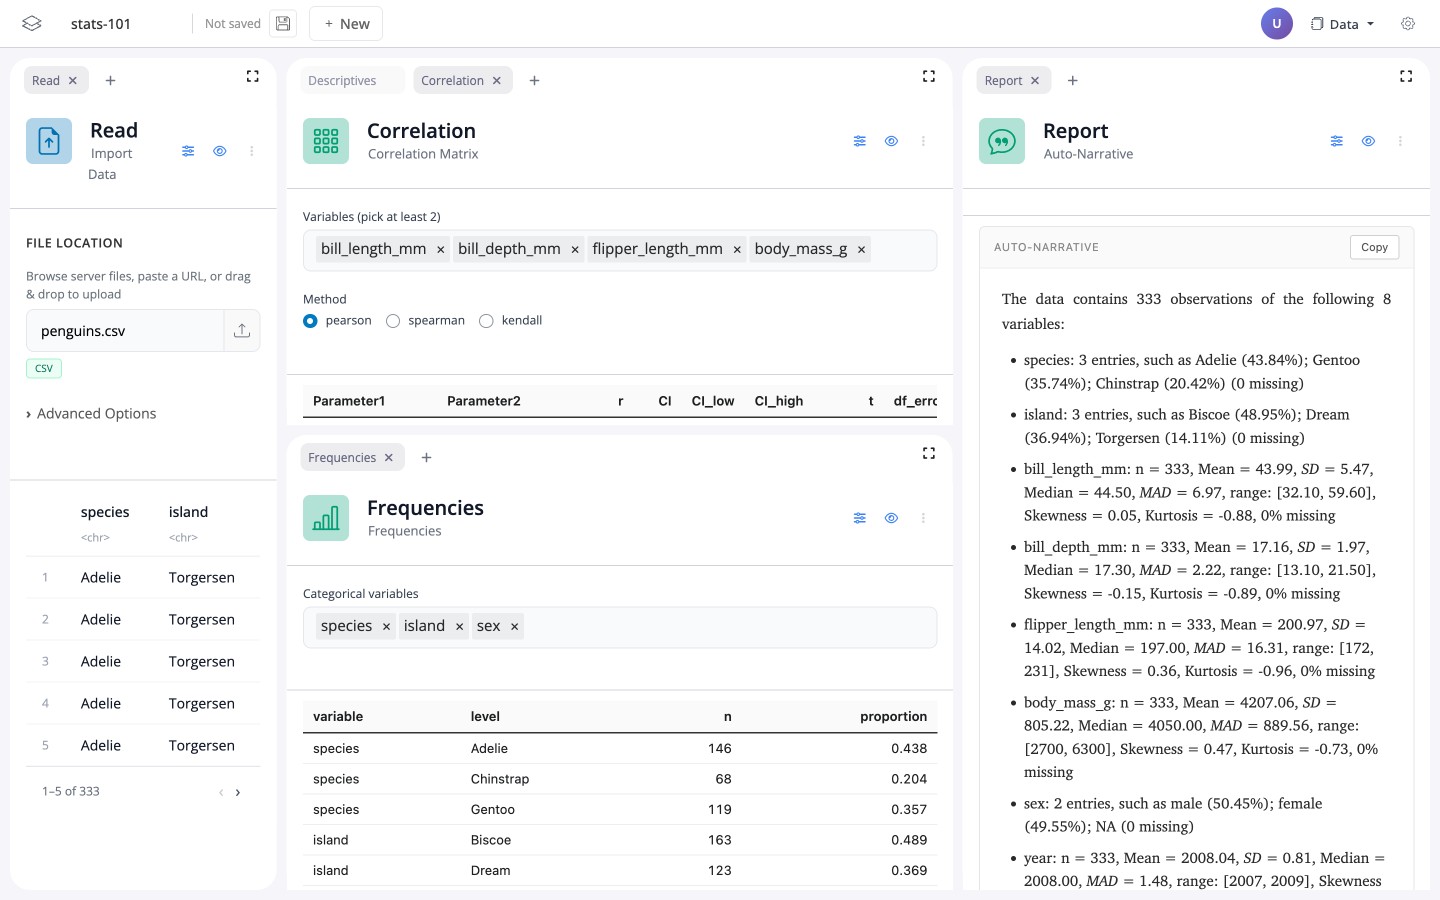
Stats 101
blockr.stats spine — describe, associate, compare, regress, effect size and Kaplan-Meier survival on penguins and lung data
Open in Playground →
Formula Input
blockr.stats formula-input widget on new_model_block plus a Kaplan-Meier survival block on NCCTG lung cancer data
Open in Playground →
Regression Playground
Turn-the-knobs-on-the-truth simulators feeding lm/glm models with marginal, residual and Q-Q diagnostics (blockr.stats + blockr.bi)
Open in Playground →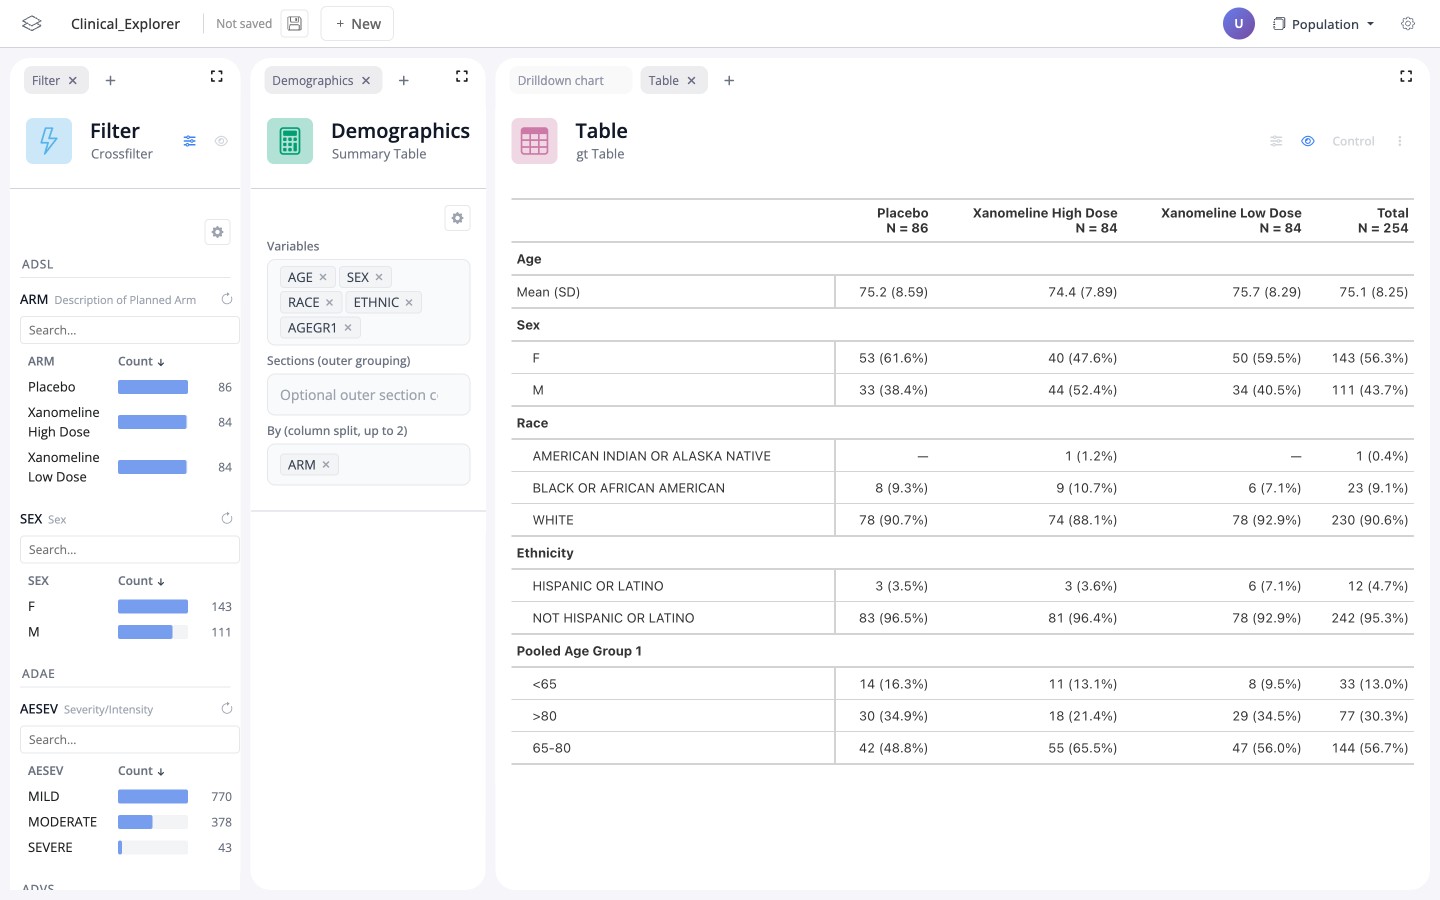
Clinical Explorer
AI-enabled clinical data explorer over pharmaverseadam (demographics, AE, lab, vitals); pre-saved demo board
Open in Playground →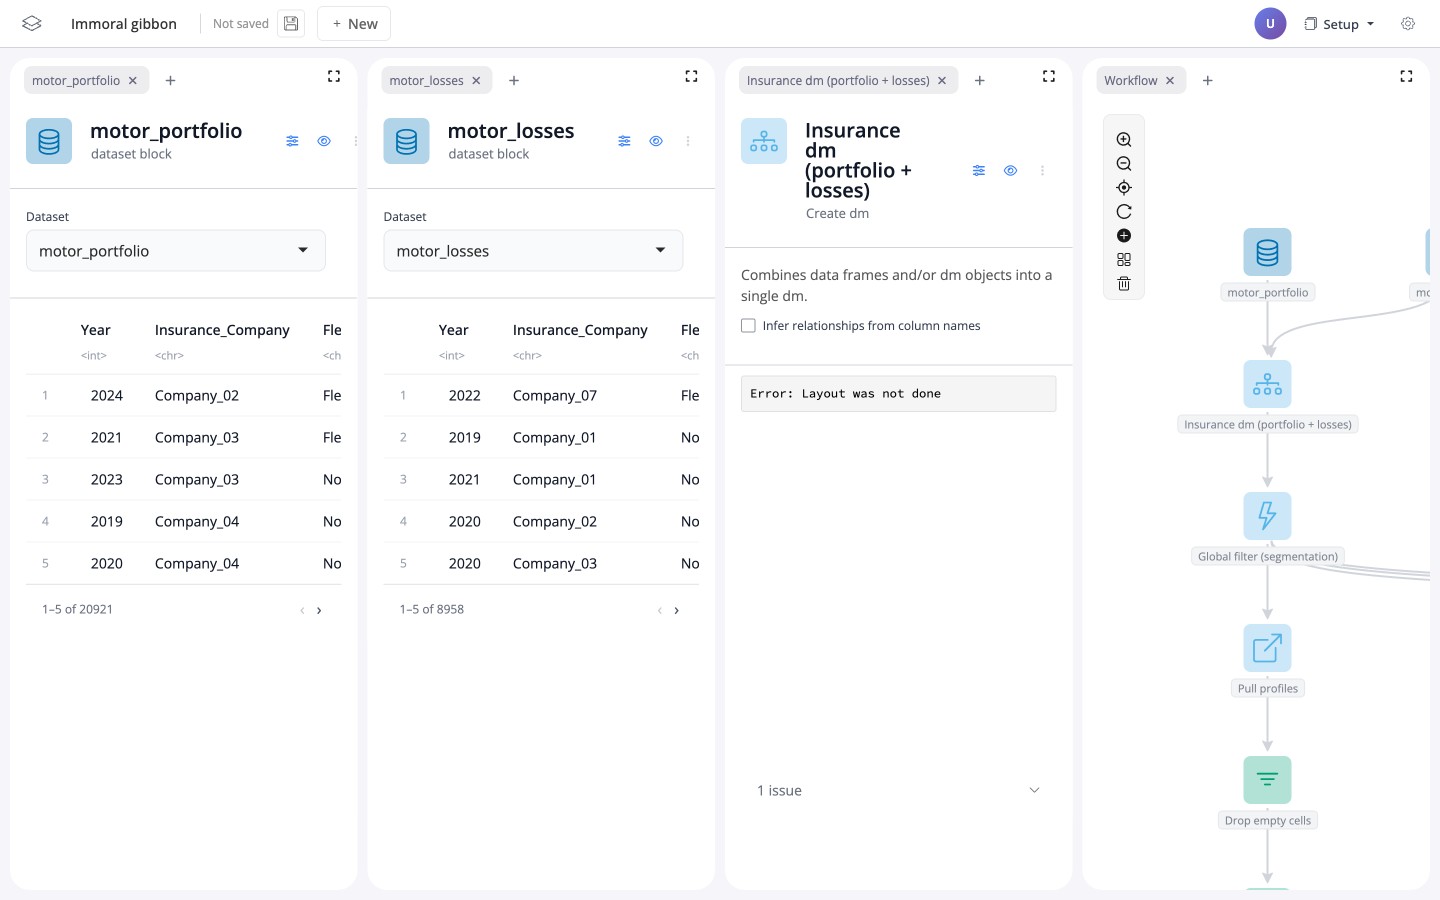
Insurance POC (Motor)
Motor-insurance dashboard (Setup / Portfolio / Profitability / Claims / Reserving) over bundled motor_portfolio + motor_losses
Open in Playground →
AI Papers Dashboard
Interactive BI dashboard showing AI research adoption across continents and fields
Open in Playground →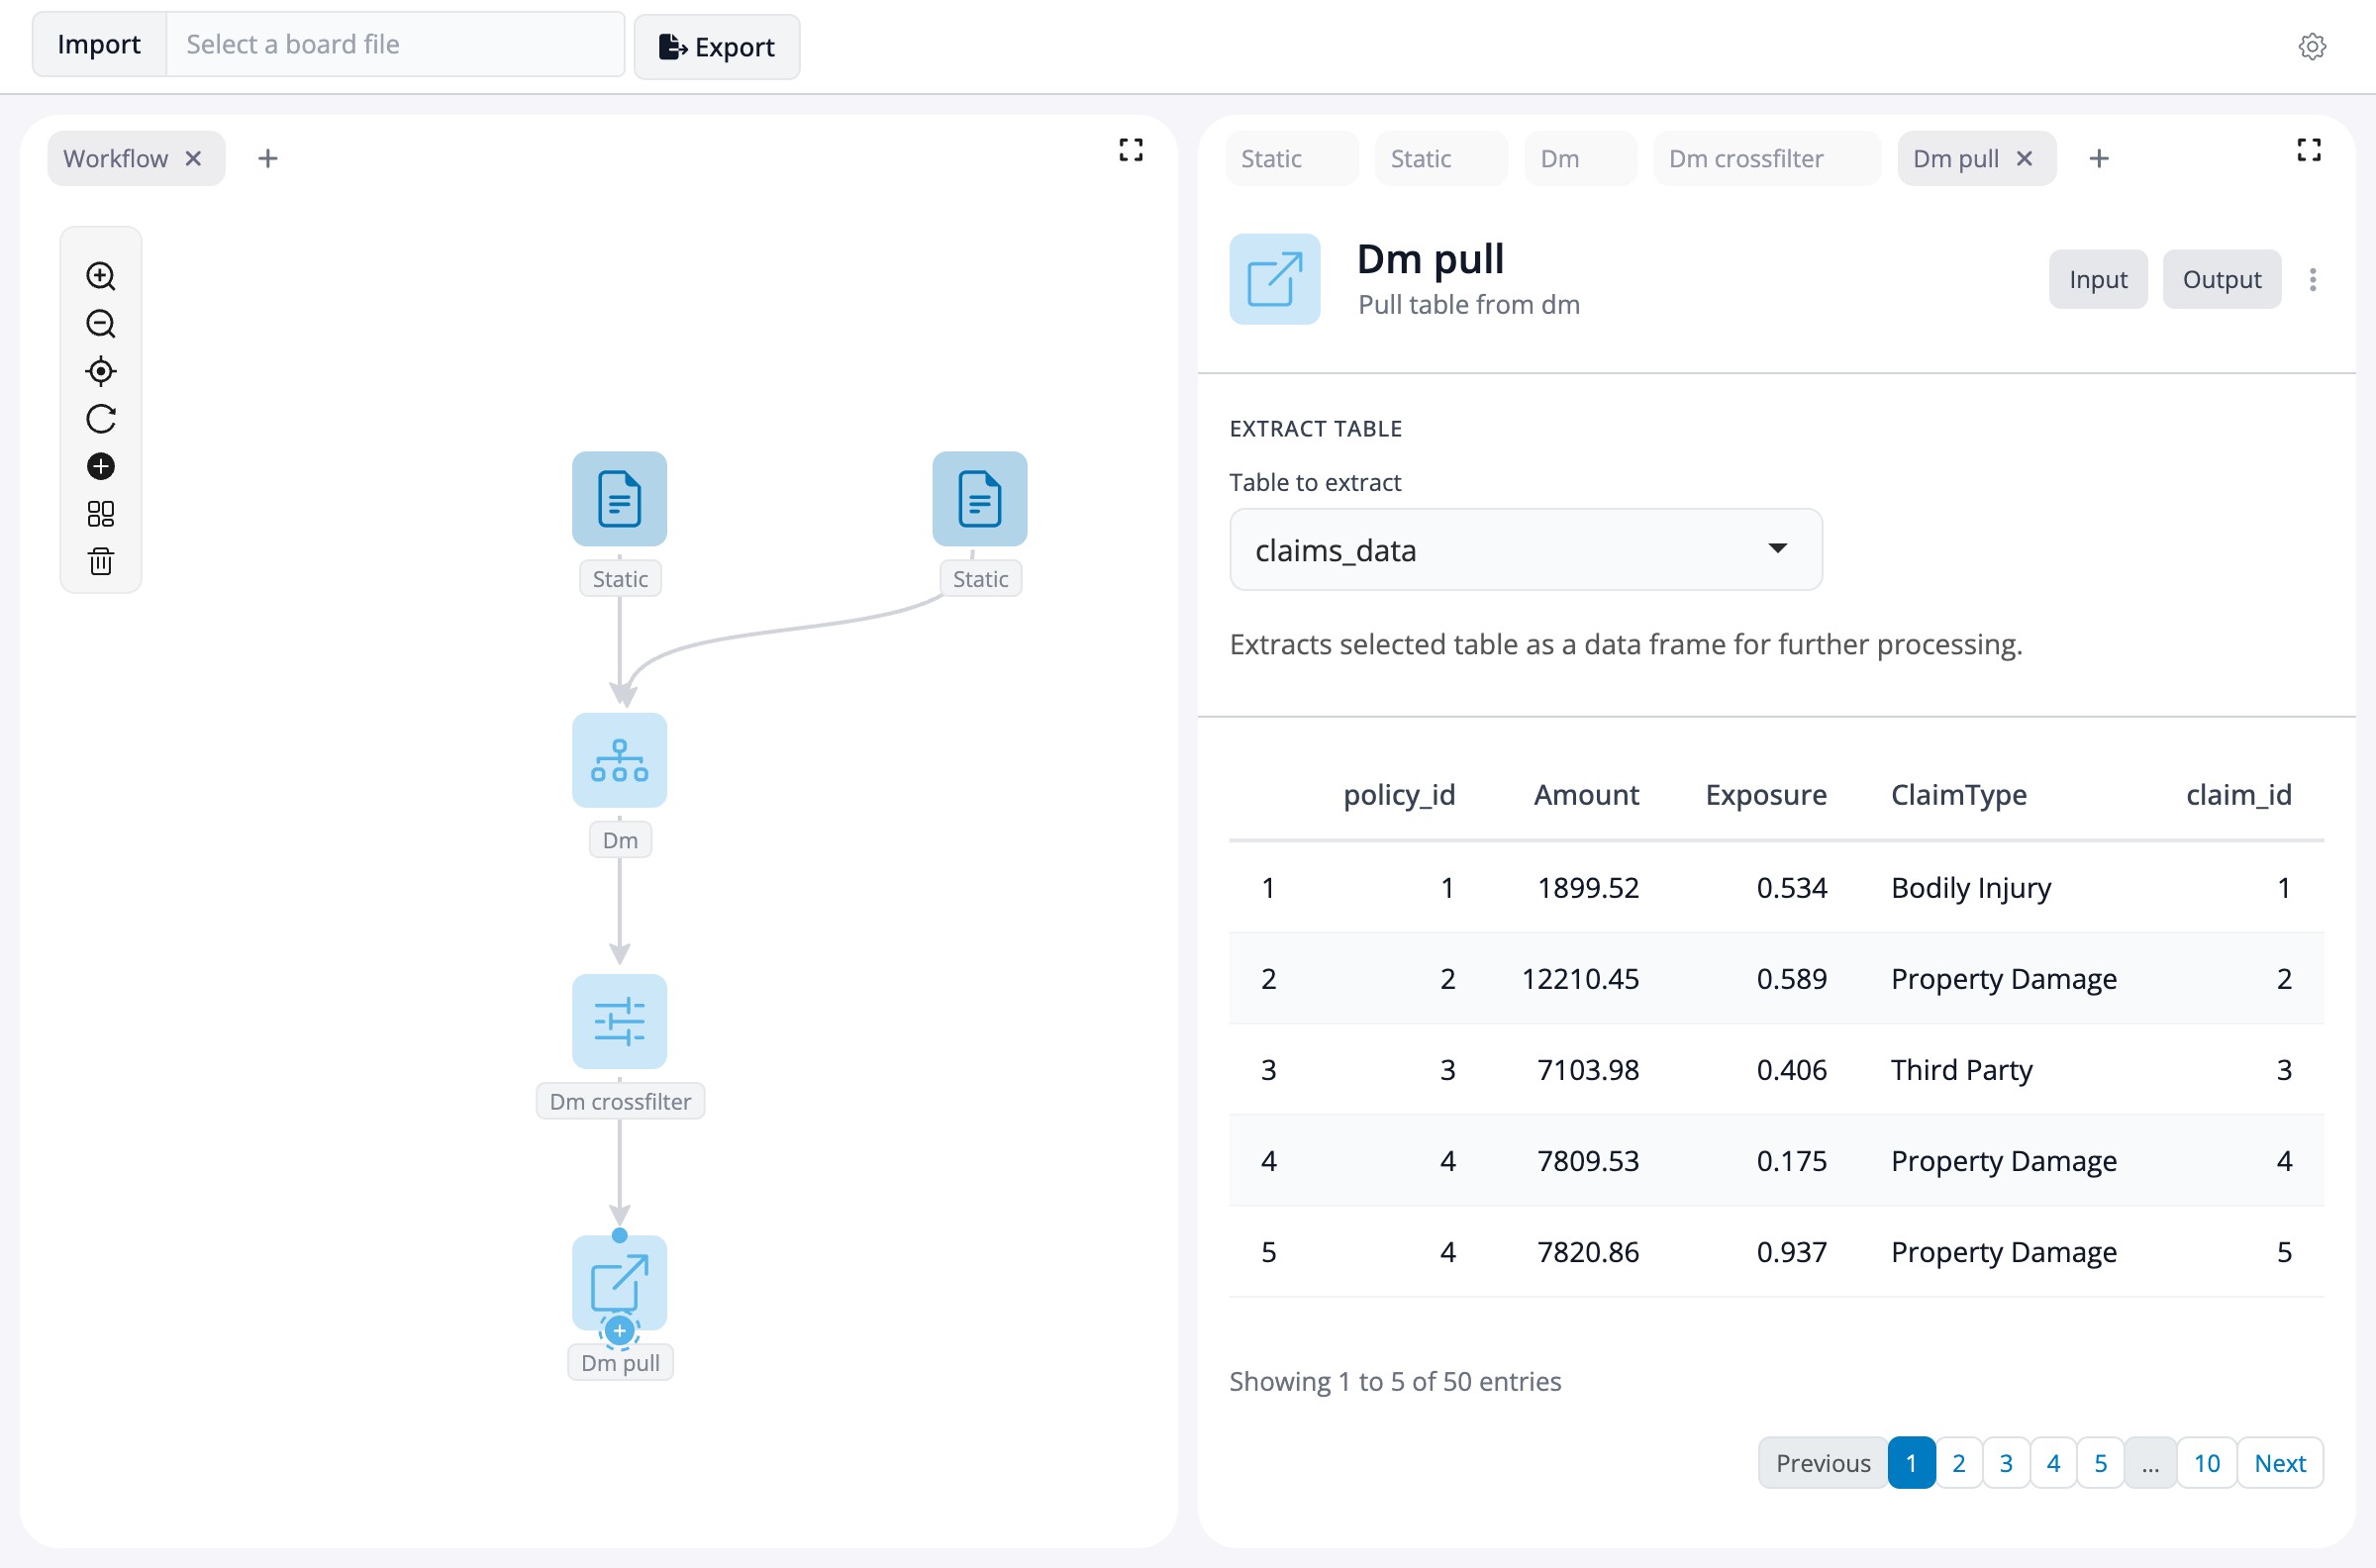
Insurance Portfolio
Star schema insurance data with dm crossfilter and measure selector
Open in Playground →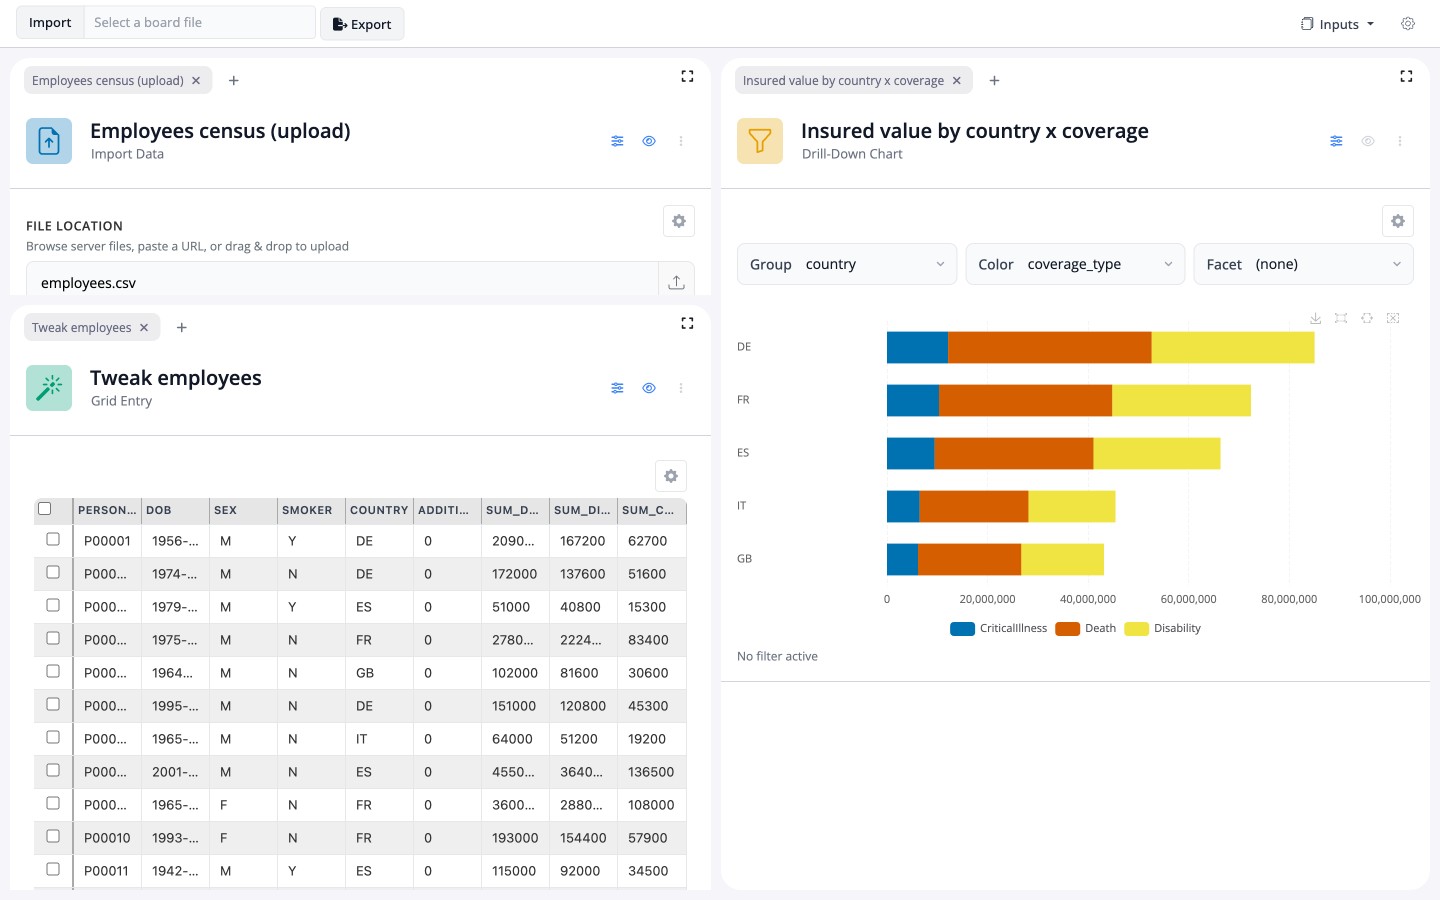
Life UWR Workbench
Life-insurance underwriting workbench (Inputs / Claims / Underwrite / Analysis / Actuarial) built on blockr.insurance datasets
Open in Playground →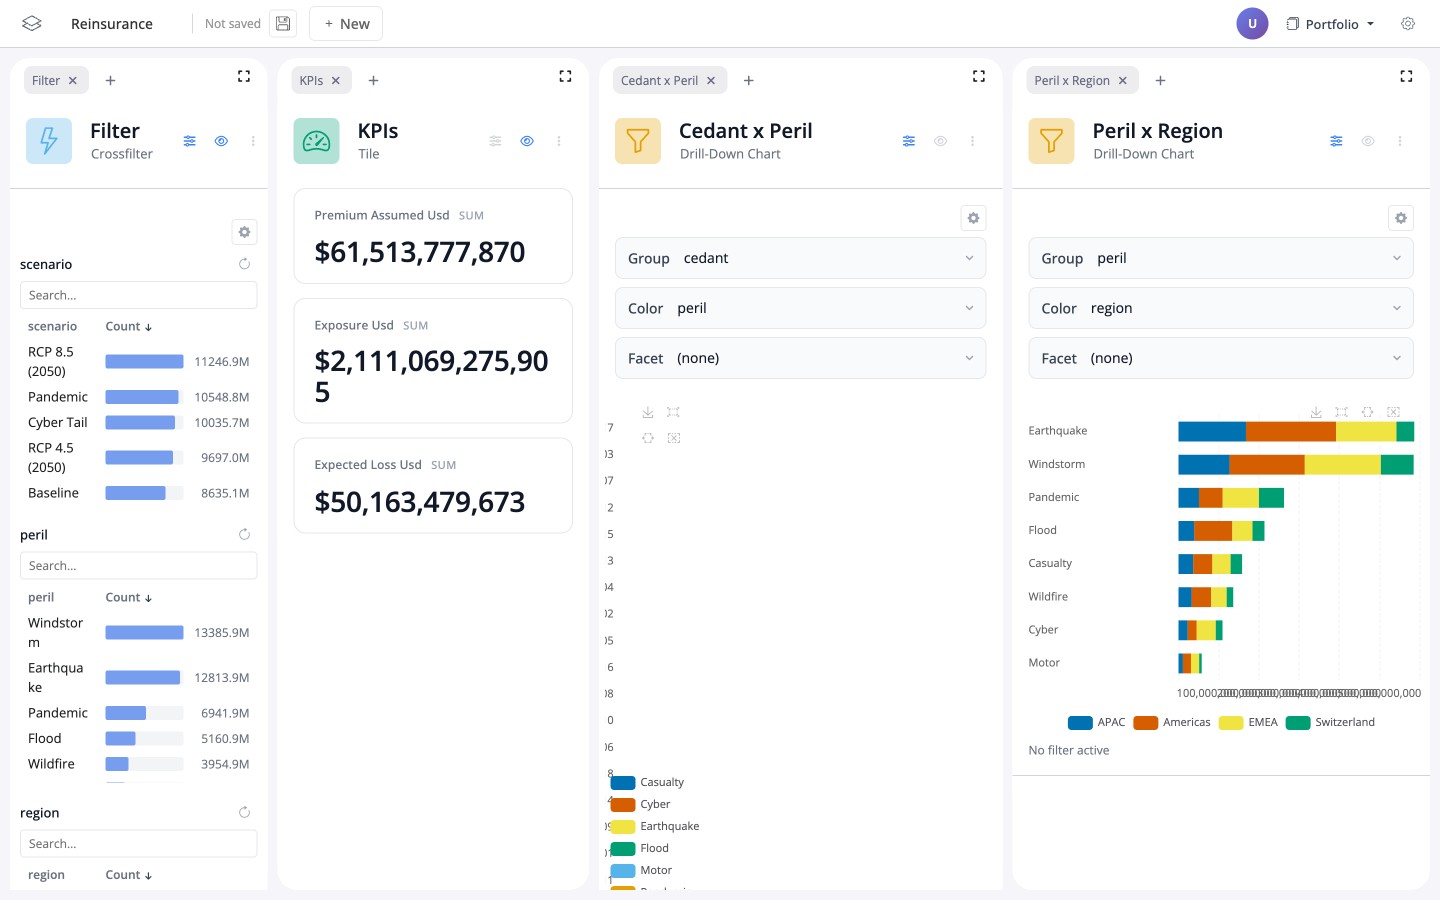
Reinsurance Dashboard
Reinsurance portfolio dashboard (Portfolio / PML / Cedant profile) over bundled exposure, events and cedants datasets
Open in Playground →
Pareto Tower (Reinsurance)
Piecewise-Pareto tower matching demo (Riegel 2018) — edit a tower, fit Pareto αs, simulate years, verify layer means, view exceedance curve
Open in Playground →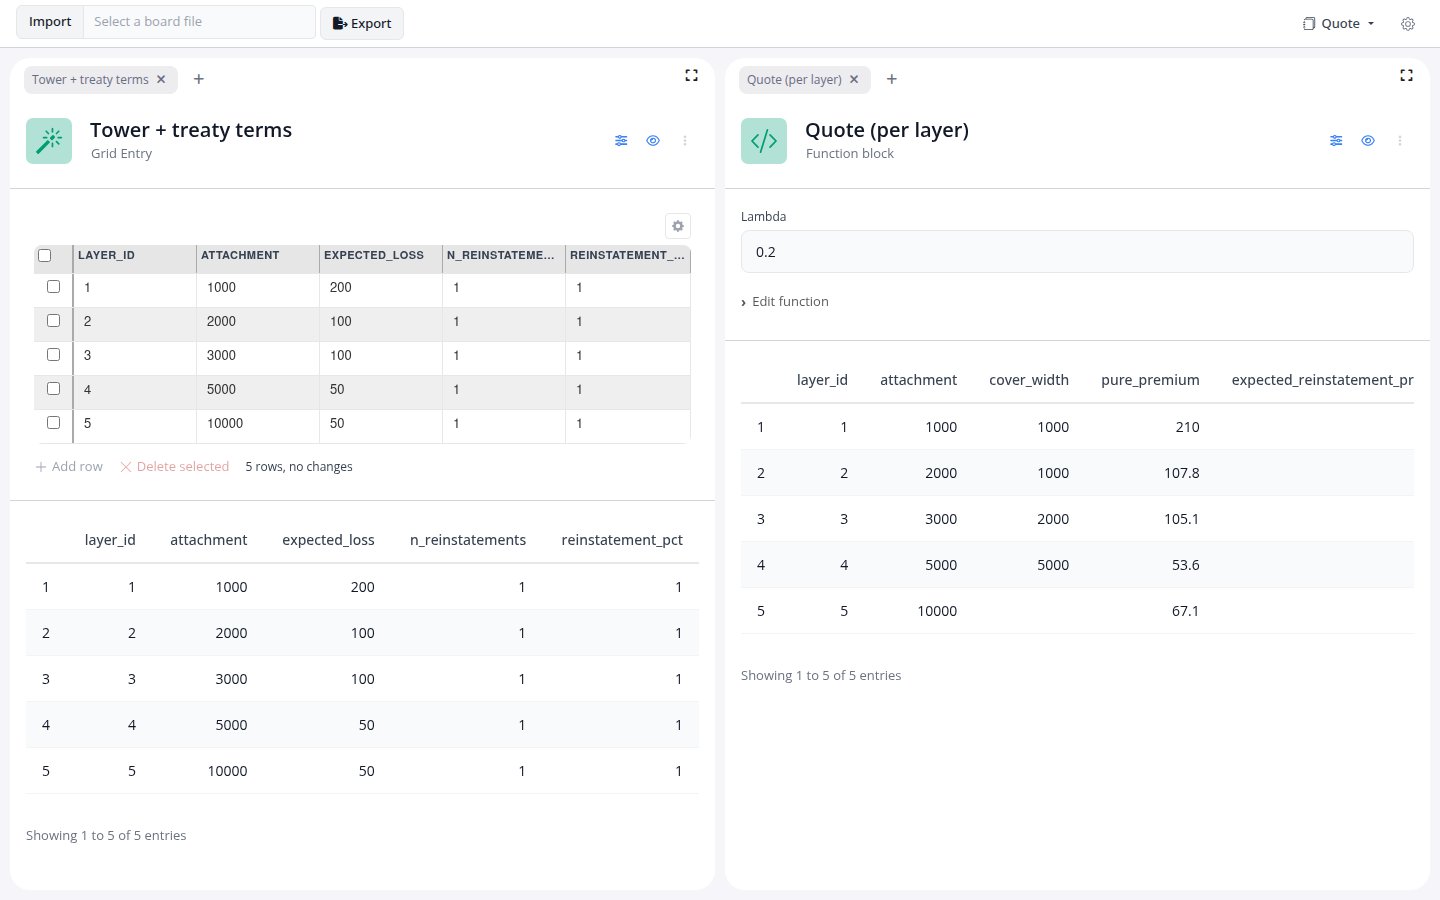
Treaty Pricer (Reinsurance)
Layered XL pricer — tower + Pareto fit + simulation + reinstatement accounting → per-layer technical premium
Open in Playground →
Actuarial Workbench
Property-insurance actuarial workbench (portfolio inputs, pricing grids, premium comparison) over the bundled property portfolio
Open in Playground →
ECharts Gallery
All ECharts visualization types - scatter, line, bar, pie, heatmap, sankey, gauge, and more
Open in Playground →
ADaM Crossfilter
CDISC Pilot 01 ADaM data with dynamic crossfilter (SEX, AGE, AESEV)
Open in Playground →
Tidymodels ML
Machine learning workflows with tidymodels - split, preprocess, fit, and evaluate models
Open in Playground →
Global Tabs (Workspaces)
Workspace-based layout with separate DockView instances per tab
Open in Playground →
AI Control + Pipeline Discovery
AI-powered data filtering and pipeline building from natural language
Open in Playground →
Release Pipeline (Tasks)
Software release pipeline demo using blockr.task - task management as blockr blocks
Open in Playground →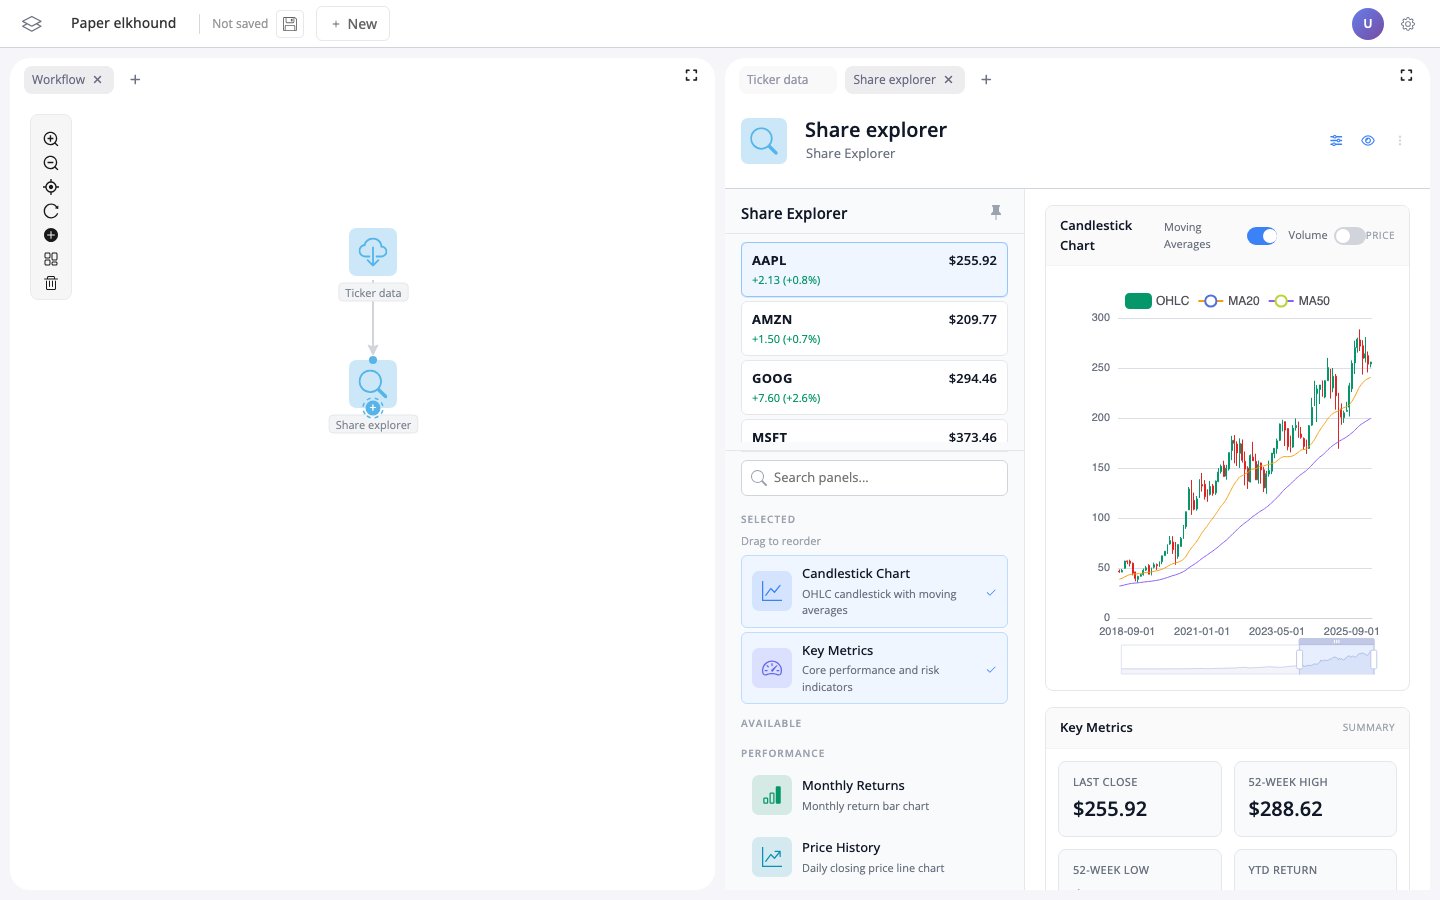
Share Explorer
Interactive stock ticker explorer with candlestick charts (blockr.portfolio)
Open in Playground →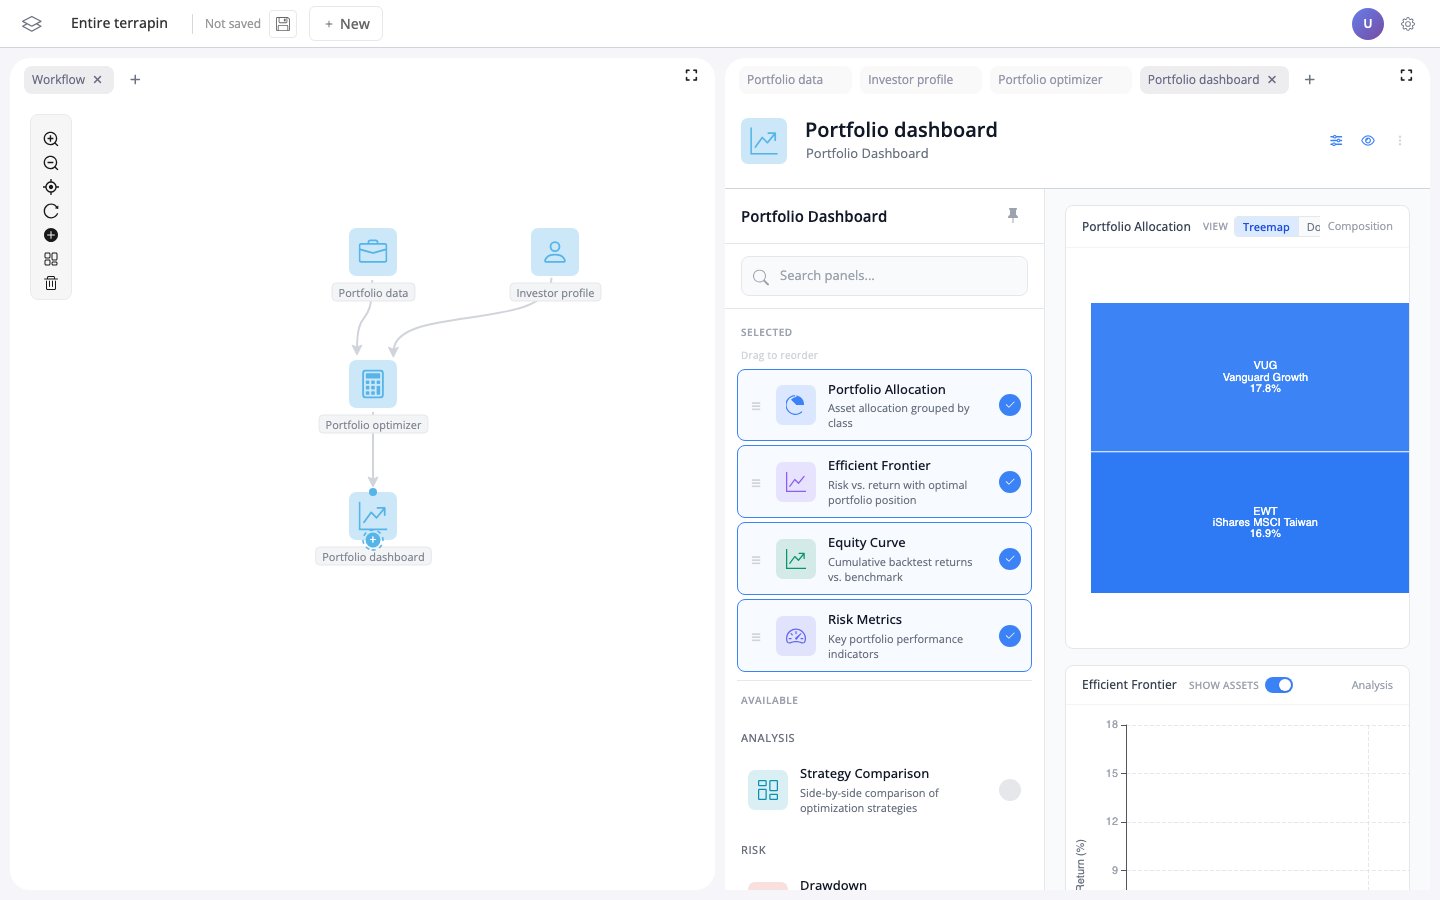
Portfolio Advisor
Portfolio optimization with investor profiling and dashboard (blockr.portfolio)
Open in Playground →
Admiral SDTM → ADSL
SDTM DM to ADSL derivation pipeline using admiral blocks (blockr.admiral)
Open in Playground →